With the fourth quarter underway—historically the best quarter for stocks, by the way—2022 is fast approaching. While a lot can still happen between now and the end of 2021, we don’t think it’s too early to start thinking about what stocks might do next year. We see a favorable economic environment for stocks in 2022, consistent with prior mid-cycle expansion years and bolstered by continued earnings growth. The gains may not come easy, however, with a number of risks such as COVID-19-related supply chain disruptions, inflation, and higher interest rates.
We Start Top Down
As 2021 winds down, we are starting to look ahead to 2022. As a starting point to begin forecasting stock market performance next year, we want to first assess the economic growth outlook and where we are in the economic cycle. If we are approaching the middle of an economic cycle that has at least a few more years to go (our view), then we believe the chances of another good year for stocks in 2022 are fairly high. Mid-cycle simply means we do not believe a recession is likely anytime soon—nor do we expect the big equity gains typically seen when the economy emerges from recession (those came last year). Looking back at the past 50 years, the S&P 500 Index was up an average of 12% during the 27 mid-cycle years we identified, with gains in 81% of those years.
We also acknowledge that stocks are up a lot and valuations are elevated (more on that below). The S&P 500 is up 16% year-to-date and 95% since the March 2020 low, which to us means the probability of another big up year in 2022 is relatively low. However, with the economy poised to grow (we expect above-average gross domestic product growth in 2022) the chances of solid gains remain high.
Earnings Are A Key Piece of the Puzzle
A growing economy is a great start, but stocks fundamentally derive their value from their earnings stream and earnings start with revenue. The environment for companies to grow revenue next year should be excellent with above-average potential economic growth and some pricing power from elevated inflation.
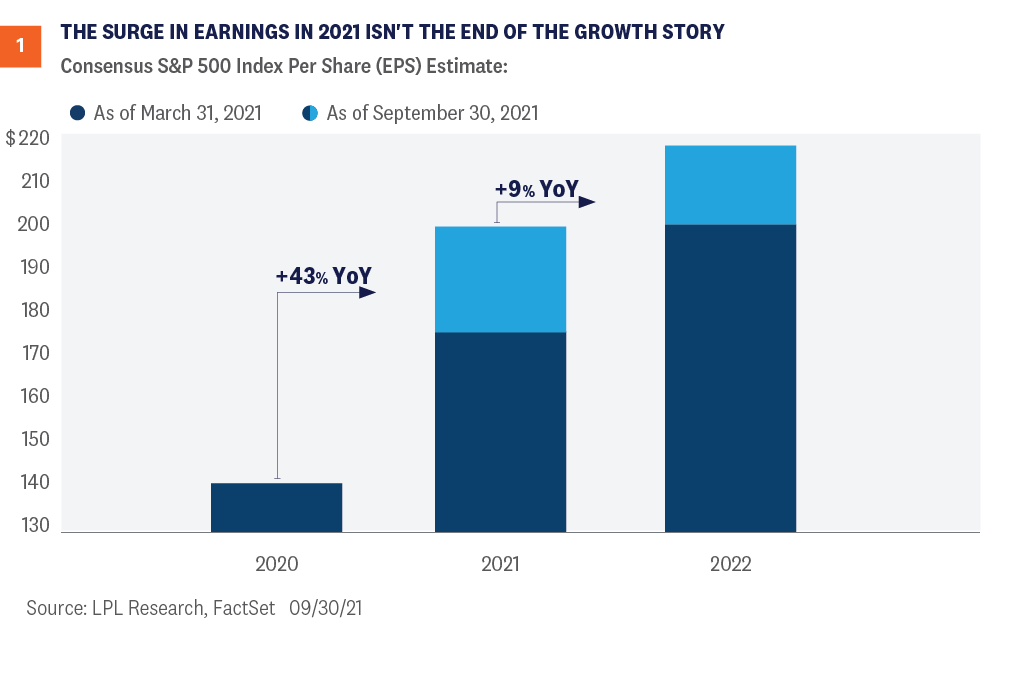
Historically, S&P 500 revenue growth is well correlated to nominal gross domestic product (GDP) growth. Nominal GDP growth is real GDP growth (inflation adjusted) plus inflation. Hypothetically, 4% GDP growth next year (consensus forecast of Bloomberg-surveyed economists) plus perhaps 3% inflation (consensus forecast for the increase in the Consumer Price Index) puts a 7% revenue increase in play. Without any change in profit margins (probably too rosy but let’s keep it simple) and some share repurchases to lower the share counts—a near 10% increase in earnings in 2022 looks to be within the realm of possibility, which is reflected in current consensus estimates shown in Figure 1. Significant earnings momentum is also bullish, with estimates having been raised significantly by analysts over the past six months, also shown in Figure 1.

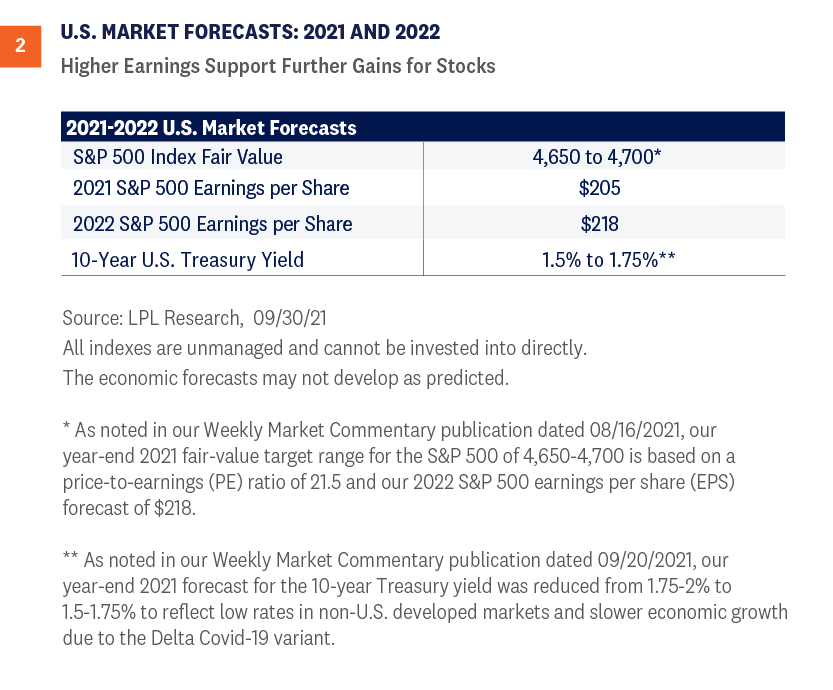
But COVID-19-related supply chain issues and materials and labor shortages may push costs up and pressure corporate profit margins in 2022. Several companies have already warned of such pressures ahead of third-quarter earnings season (more on that in an upcoming commentary). As a result, we are forecasting S&P 500 earnings growth of 6% in 2022—$218 per share after $205 per share in 2021, shown in Figure 2. However, higher corporate taxes, which we see as likely, may eat into much of those earnings gains in 2022. So, while we anticipate stocks will get some help from earnings in 2022 and expectations for more earnings growth in 2023, uncertainty is clearly high.

Early Thoughts on 2022 Stock Market Forecast
As we think about where stocks might go in 2022, we want to assess where valuations might be in a year and what type of earnings growth markets may be pricing in for 2023 at that time.
Looking at valuations first, they are elevated—but strong earnings gains during the ongoing economic recovery and the recent stock market pullback have lowered the price-to-earnings ratio (P/E) for the S&P 500 to about 20.5. Interestingly, the S&P 500 is up 16% year-to-date while the consensus estimate for the index’s EPS in 2021 has risen 20% since January 1, showing that stocks are actually cheaper now than they were at the start of this year. We believe still low interest rates justify current valuation levels, but if rates rise next year as we expect, P/E multiples are unlikely to rise and may edge lower. That means earnings growth will likely be the primary driver of stock market gains in 2022.
Turning to earnings and looking beyond next year, if we assume S&P 500 EPS growth returns to its long-term average in 2023 of about 9% ($218 to roughly $237), while the P/E stays at 20.5, the S&P 500 could be fairly valued at 4,870 at the end of 2022, or 12% above the September 30 close. That seems like a reasonable place to start—though that is not our official forecast—with several percentage points of gains potentially coming in the fourth quarter. The upside to that could come from valuations if interest rates stay lower for longer. The downside could come from margin pressures, particularly wages, which could chop a few more points off of earnings growth over the next year or two.
Conclusion
It’s not too early to start thinking about 2022 as the fourth quarter gets underway. Prospects for above-average economic growth and further earnings gains next year point to another good year for stock investors. We expect interest rates to stay low enough to justify maintaining current valuations, which could set the stage for double-digit returns for the S&P 500 next year. Look for more on the earnings outlook in an upcoming commentary previewing third-quarter earnings. And once earnings season gets rolling, we’ll get rolling on writing Outlook 2022.
Finally, for those more concerned about finishing up 2021 than what 2022 may have in store, we would not be surprised to see a bit more volatility around China, Covid-19, the Federal Reserve taper, high inflation, supply chain disruptions, and Washington, D.C., headlines. We would look to be buyers on dips given the mostly favorable macroeconomic backdrop, low interest rates, and historically strong fourth-quarter returns.
Click here to download a PDF of this report.
IMPORTANT DISCLOSURES
This material is for general information only and is not intended to provide specific advice or recommendations for any individual. There is no assurance that the views or strategies discussed are suitable for all investors or will yield positive outcomes. Investing involves risks including possible loss of principal. Any economic forecasts set forth may not develop as predicted and are subject to change.
References to markets, asset classes, and sectors are generally regarding the corresponding market index. Indexes are unmanaged statistical composites and cannot be invested into directly. Index performance is not indicative of the performance of any investment and do not reflect fees, expenses, or sales charges. All performance referenced is historical and is no guarantee of future results.
Any company names noted herein are for educational purposes only and not an indication of trading intent or a solicitation of their products or services. LPL Financial doesn’t provide research on individual equities.
All information is believed to be from reliable sources; however, LPL Financial makes no representation as to its completeness or accuracy.
U.S. Treasuries may be considered “safe haven” investments but do carry some degree of risk including interest rate, credit, and market risk. Bonds are subject to market and interest rate risk if sold prior to maturity. Bond values will decline as interest rates rise and bonds are subject to availability and change in price.
The Standard & Poor’s 500 Index (S&P500) is a capitalization-weighted index of 500 stocks designed to measure performance of the broad domestic economy through changes in the aggregate market value of 500 stocks representing all major industries.
The PE ratio (price-to-earnings ratio) is a measure of the price paid for a share relative to the annual net income or profit earned by the firm per share. It is a financial ratio used for valuation: a higher PE ratio means that investors are paying more for each unit of net income, so the stock is more expensive compared to one with lower PE ratio.
Earnings per share (EPS) is the portion of a company’s profit allocated to each outstanding share of common stock. EPS serves as an indicator of a company’s profitability. Earnings per share is generally considered to be the single most important variable in determining a share’s price. It is also a major component used to calculate the price-to-earnings valuation ratio.
All index data from FactSet.
Please read the full Midyear Outlook 2021: Picking Up Speed publication for additional description and disclosure.
This research material has been prepared by LPL Financial LLC.
Securities and advisory services offered through LPL Financial (LPL), a registered investment advisor and broker-dealer (member FINRA/SIPC). Insurance products are offered through LPL or its licensed affiliates. To the extent you are receiving investment advice from a separately registered independent investment advisor that is not an LPL affiliate, please note LPL makes no representation with respect to such entity.
Not Insured by FDIC/NCUA or Any Other Government Agency | Not Bank/Credit Union Guaranteed | Not Bank/Credit Union Deposits or Obligations | May Lose Value
RES-858158-0821 | For Public Use | Tracking # 1-05196942 (Exp. 10/22)